A story about how one scary function accompanied me for more than 5 years.
The First Encounter
Once upon a time I was working on a “blue pill”-like hypervisor - hvpp - a small Windows driver that enables virtualization of the running system. The purpose was to monitor and research the behavior of the system. I was experimenting with various virtualization features, but two of them are the main actors in this story: EPT and RDTSC trapping.
I’ve started to get crashes with this call stack:
0: kd> kb
 # RetAddr               : Call Site
00 fffff802`46f0341d     : nt!RtlScrubMemory+0xd
01 fffff802`46f03206     : nt!MiScrubPage+0x145
02 fffff802`474b35ff     : nt!MiScrubNode+0x196
03 fffff802`46cc7835     : nt!MiScrubMemoryWorker+0x6f
04 fffff802`46d49925     : nt!ExpWorkerThread+0x105
05 fffff802`46ddcd5a     : nt!PspSystemThreadStartup+0x55
06 00000000`00000000     : nt!KiStartSystemThread+0x2a
The instruction that was causing the crash was RDTSC inside the
RtlScrubMemory function. The memory scrubbing involves - among other things -
unmapping a page, calling RtlScrubMemory, and then mapping it back. And the
page in question was the page that was holding the hypervisor code. So when
RDTSC was executed, the hypervisor crashed.
My first thought was that there must be some way to disable this memory scrubbing.
Let’s find out what triggers MiScrubMemoryWorker:

Alright, there’s just one single caller: MmScrubMemory. What calls that function?

Huh. It comes directly from NtSetSystemInformation. It means basically
anything can trigger it. After looking at the particular reference in
NtSetSystemInformation, I figured that the SystemInformationClass has number
127 and through the magic of consulting phnt I finally obtained the
infoclass name: SystemScrubPhysicalMemoryInformation.
Since any process can call NtSetSystemInformation, and since I didn’t want to
be too invasive (e.g. by hooking the NtSetSystemInformation), my next thought
was that there must be some way to prevent the memory scrubbing from touching
the hypervisor code. There was no information about this function on the
internet (still isn’t), so I’ve decided to summon the power of the Twitter
hive-mind:
Oh god, It was more than 5 years ago…

Well, I didn’t get an answer, but at least I’ve learned the purpose of the
MmScrubMemory function.
At that time, I’ve resolved the issue by not dealing with it.
I’ve realized that I don’t need the RDTSC trapping in this
case, so I’ve disabled it, and the crashes were gone.
The Second Encounter
After a year or so, I was still experimenting with the hypervisor.
This time I was working on monitoring user-mode programs. My first thought
was to use the CR3 register as a key to identify the process.
I was quickly burned by the fact that the CR3 register (or more precisely,
the DirectoryTableBase field in the KPROCESS structure) can change during
the execution of a process:
It was again the memory scrubbing that was causing the DirectoryTableBase
change!
1: kd> kb
 # RetAddr               : Call Site
00 fffff802`46cfd5f5     : nt!KeSwapDirectoryTableBase
01 fffff802`46cf0dee     : nt!MiStealPage+0xcb1
02 fffff802`46cf09a3     : nt!MiTradePage+0x34e
03 fffff802`46f031ec     : nt!MiClaimPhysicalRun+0xbb
04 fffff802`474b35ff     : nt!MiScrubNode+0x17c
05 fffff802`46cc7835     : nt!MiScrubMemoryWorker+0x6f
06 fffff802`46d49925     : nt!ExpWorkerThread+0x105
07 fffff802`46ddcd5a     : nt!PspSystemThreadStartup+0x55
08 00000000`00000000     : nt!KiStartSystemThread+0x2a
Thankfully, this was an easy fix. Instead of using the CR3 register, I’ve used
the EPROCESS pointer returned by the PsGetCurrentProcess() function as the
key.
Fast-forward 5 years
… and I’m getting crashes in similar place. This time I’m working on a page-table monitor.
Page table monitoring works by tracking changes in page table entries.
First, the DirectoryTableBase (CR3) of a process is resolved. Then, each
subsequent page-table structure is followed down to the leaf page table entries.
When the PRESENT bit or PFN bits in some page-table entry change, the
monitored page table structure is adjusted. You can see the code in action in
the PageTableMonitor implementation of the vmi-rs project.
Now, I’ve started getting non-sensical PT updates. Some PTs started to point to PFNs that were beyond the bounds, some PTs were zeroed out and the page-table monitor ended up in an inconsistent state. This didn’t make sense, until I realized… the memory scrubbing!
More precisely, the KeSwapDirectoryTableBase function - again.
See, the whole page table structure is in physical memory. But the root of the
structure is in the KPROCESS::DirectoryTableBase. But what monitors
DirectoryTableBase for changes? That’s right, nothing.
Monitoring DirectoryTableBase field would cost a lot of performance, since
the granularity of memory monitoring is 1 page, and the KPROCESS structure
tends to change a lot. Besides that, it wouldn’t even help in this case, because
the memory scrubbing scrubs the page tables first and only then sets the
new DirectoryTableBase. So we would get into inconsistent state anyway.
I had no choice but to find a way to prevent the memory scrubbing from remapping the root of the page table structure.
But First…
I was still interested in what exactly is triggering the memory scrubbing.
Finding what calls
NtSetSystemInformation(SystemScrubPhysicalMemoryInformation, ...) by static
analysis would be tiresome, so I resorted to good ol’ dynamic analysis:
bp nt!NtSetSystemInformation "j (@rcx == 0n127) '? rcx';'gc'"
This sets up a conditional breakpoint in WinDbg. The debugger will break on
NtSetSystemInformation only when the rcx register is equal to 127 - in
other words, the debugger will break only if the NtSetSystemInformation was called
with SystemScrubPhysicalMemoryInformation as the first argument.
Let’s hit F5, and sure enough, after some time, we hit the jackpot:
0: kd> kb
 # RetAddr               : Call Site
00 fffff802`46de6e95     : nt!NtSetSystemInformation
01 00007fff`a613f4d4     : nt!KiSystemServiceCopyEnd+0x25
02 00007fff`7ef944cc     : ntdll!NtSetSystemInformation+0x14
03 00007fff`7ef94cae     : MemoryDiagnostic!CMemoryDiagnosticHandler::StartMemoryTest+0xc0
04 00007fff`7ef91369     : MemoryDiagnostic!CMemoryDiagnosticHandler::Worker+0x3ee
05 00007fff`a5897944     : MemoryDiagnostic!CWinTaskHandler::WorkerThreadProc+0x29
06 00007fff`a610ce71     : KERNEL32!BaseThreadInitThunk+0x14
07 00000000`00000000     : ntdll!RtlUserThreadStart+0x21

0: kd> !process
PROCESS ffffaa8b859b5080
    SessionId: 1  Cid: 0914    Peb: bfbe17f000  ParentCid: 015c
    DirBase: 2f1e4002  ObjectTable: ffffcf856457ac80  HandleCount: 390.
    Image: taskhostw.exe
It looks like we’re dealing with some kind of scheduled task.
Thankfully, MemoryDiagnostic.dll is quite small DLL - around 50 kb in size.
Let’s throw it into IDA and look at the CMemoryDiagnosticHandler::StartMemoryTest
function:
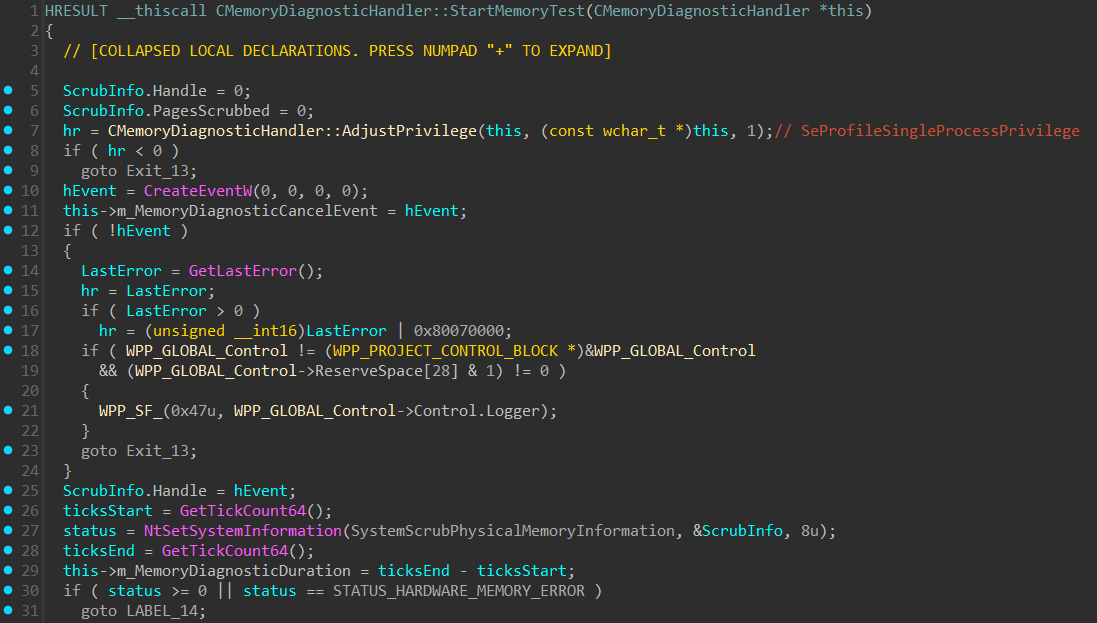
This function enables the SeProfileSingleProcessPrivilege (required for
SystemScrubPhysicalMemoryInformation), creates an abort event, and finally
calls NtSetSystemInformation. Interestingly, detected RAM defects are written
back to the boot configuration data:
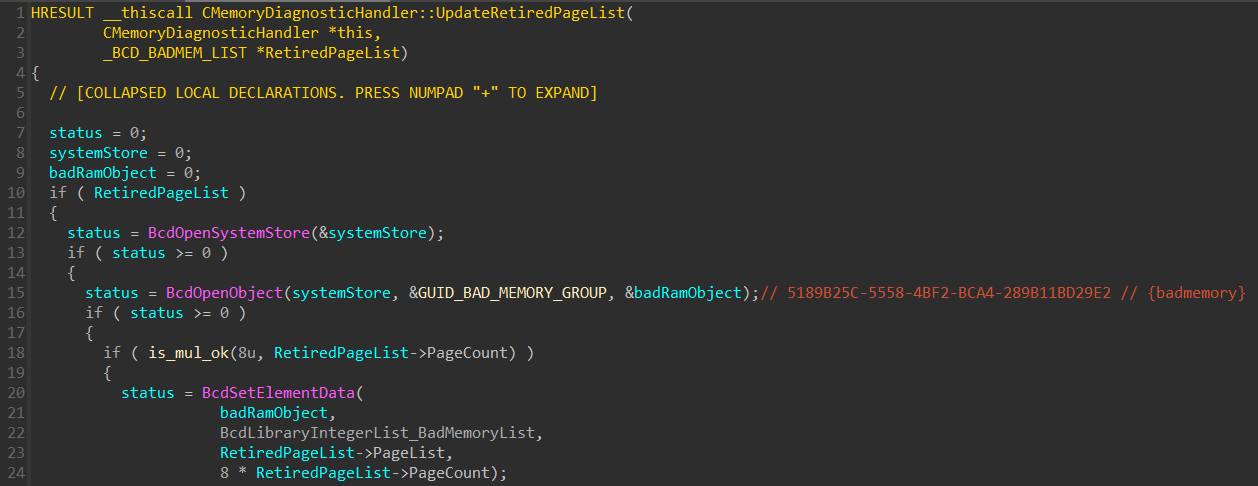
That’s smart. Windows can avoid using these faulty memory locations on
subsequent boots. The bcdedit command confirms the presence of a boot entry
with the corresponding GUID (5189b25c-5558-4bf2-bca4-289b11bd29e2):
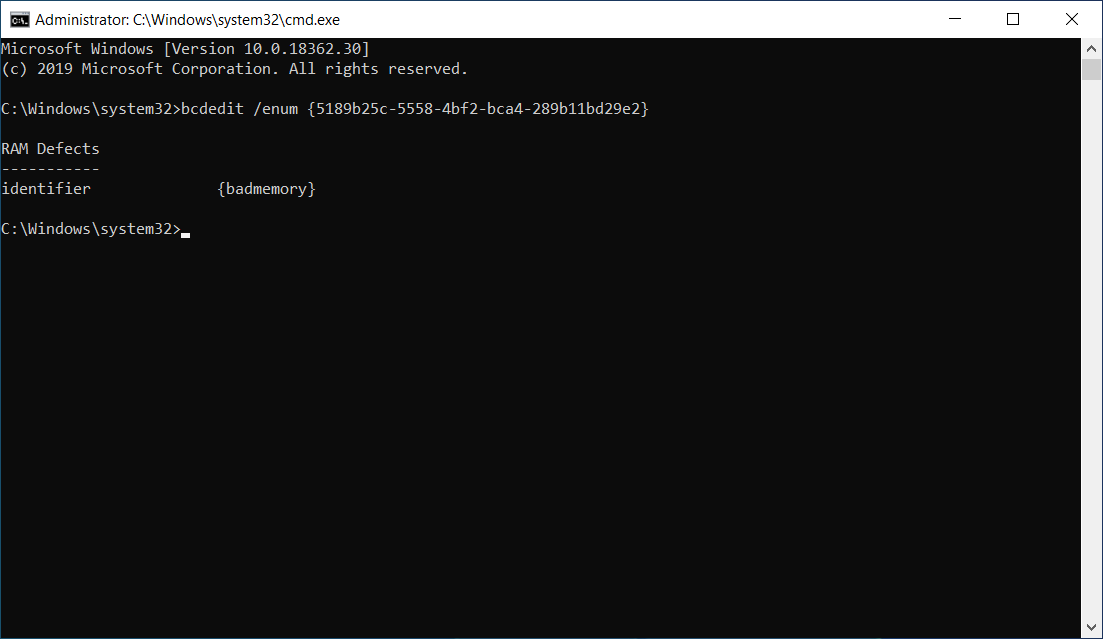
Now that we know the name, we can also get the same result by running
bcdedit /enum {badmemory}. In the command output we can see that there
aren’t any faulty memory areas, but if it were, there would be another row
named badmemorylist with list of faulty
PFNs.
The CMemoryDiagnosticHandler::ConfigureMemoryDiagnosticTask function reveals
the task itself resides under \Microsoft\Windows\MemoryDiagnostic
in the Task Scheduler:
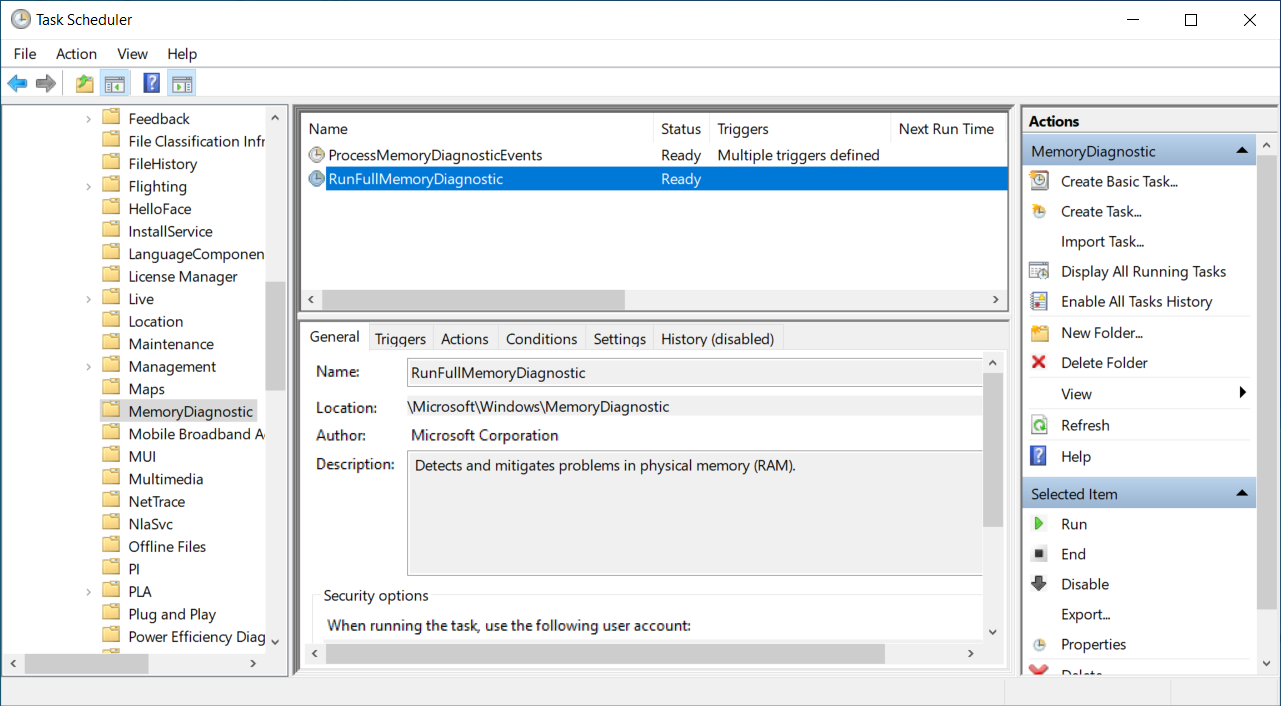
If we manually trigger the RunFullMemoryDiagnostic task, we will again hit
the breakpoint we have set up previously.
Googling RunFullMemoryDiagnostic results in plenty of results, mainly
revolving around the annoyance that it causes the System process to raise the
CPU to 100%, particularly when idle. And it makes sense:
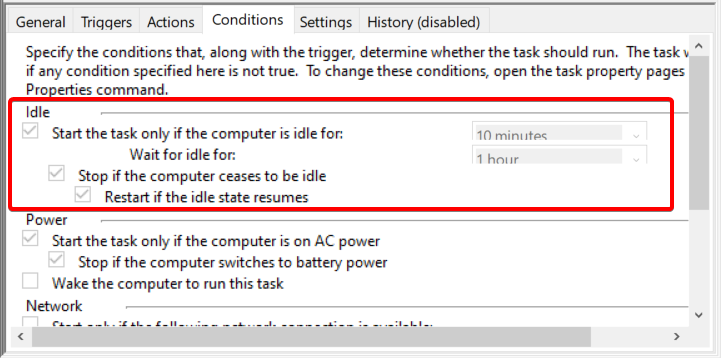
If you ever wondered why your laptop is making noise like it’s trying to fly off the table, this is one of the reasons. Not the only reason, mind you, as Microsoft carefully planted dozens of scheduled tasks to drain your battery when the laptop is idle.
You can also find the mention of RunFullMemoryDiagnostic as part of various
“debloat” scripts, that try to disable or remove this task (among others)
from the Task Scheduler. Whether this is a good idea or not is left as an
exercise for the reader. Also, I wouldn’t be surprised if these tasks would
magically reappear after some time.
Great, we’ve found the culprit. We’ve also found a way to disable it.
But it doesn’t solve the original problem - as I’ve mentioned before, the
SystemScrubPhysicalMemoryInformation can be triggered by any process.
It’s time to find …
The Solution
What I needed was a way to prevent the memory scrubbing from remapping the root
of the page table structure. Essentially, I needed to lock the page in memory.
Aha! I’ve remembered that I was dealing with something similar in the past -
I needed to prevent some user-mode memory from being paged out. For that, I’ve
used the MmProbeAndLockPages function. It might not seem relevant at first,
but the key was realizing one thing that MmProbeAndLockPages does - it
increments the reference count of the page.
So I’ve tried it - I’ve found the MMPFN structure in the MmPfnDatabase that
holds the DirectoryTableBase of some particular process, set the
ReferenceCount field to 2, and voilà! After triggering the memory scrubbing
again, the DirectoryTableBase remained untouched and the page-table monitor
was working as expected.
It turns out that the hvmi is also using this technique, so that gives me some comfort.
Now this has obvious caveats:
-
Synchronization: The kernel usually modifies the
MMPFNstructure under either process working set lock or the PFN database lock. Luckily, theReferenceCountfield is a simple 16-bit integer, so we can map the guest physical page into our virtual address space and increment it atomically. -
Cleanup: When you increment something, you should also eventually decrement it. However, I found that forgetting to do so doesn’t lead to anything catastrophic. When the process exits, the
MMPFNis freed and repurposed normally. -
Detectability: This is bad news if you’re trying to be as stealthy as possible. If the
ReferenceCountof theDirectoryTableBasePFN is 2 or more, it’s a dead giveaway that someone is tampering with the system. The system won’t be lockingDirectoryTableBasepages by itself.
The End
Finally, I have conquered the MmScrubMemory function. It took me more than 5
years to get an answer to my original question.
What I’ve found interesting is that the Windows Internals is also silent about memory scrubbing. It does casually mention memory diagnostic at the very end of Part 2 (despite memory manager is being described in the middle of Part 1), but that’s it.
Nevertheless, I’ve learned something new, and I hope you did too. I’m still not entirely satisfied with the solution since its effects are observable, but for the time being, it’ll have to do.
If by any chance you come across a better solution, please let me know!
